Case study: a boat photo, before and after GCR
One photo with large dark areas, converted to GRACoL 2013 with a standard ICC conversion and with GCRflow. This page lists the conditions, the ink measured on every pixel and how to read the images. The figures describe this one file.
Before and after
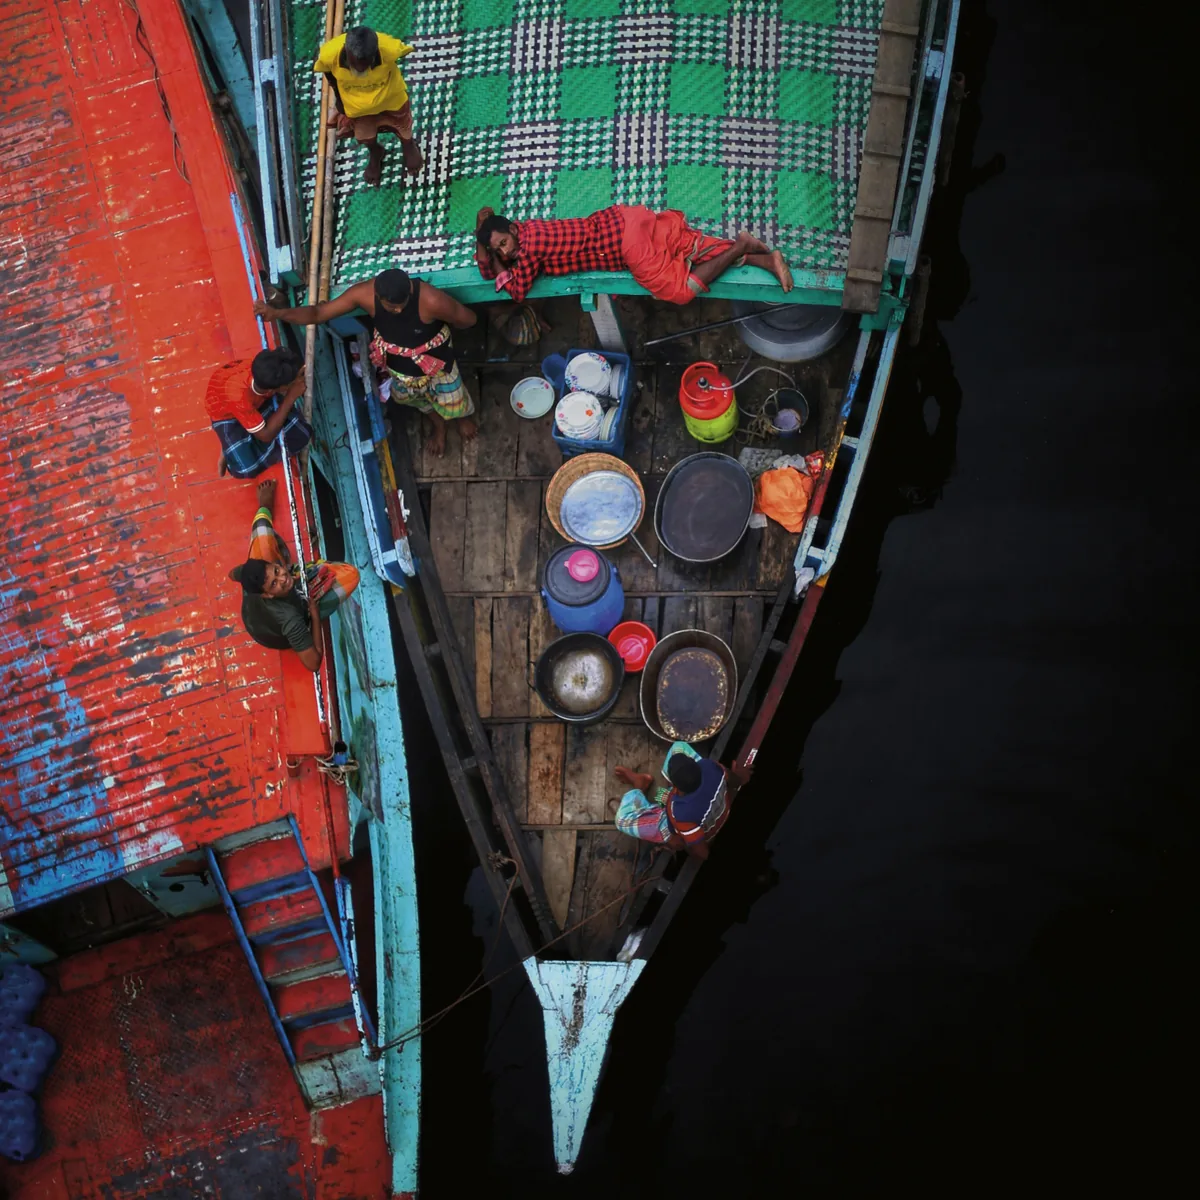
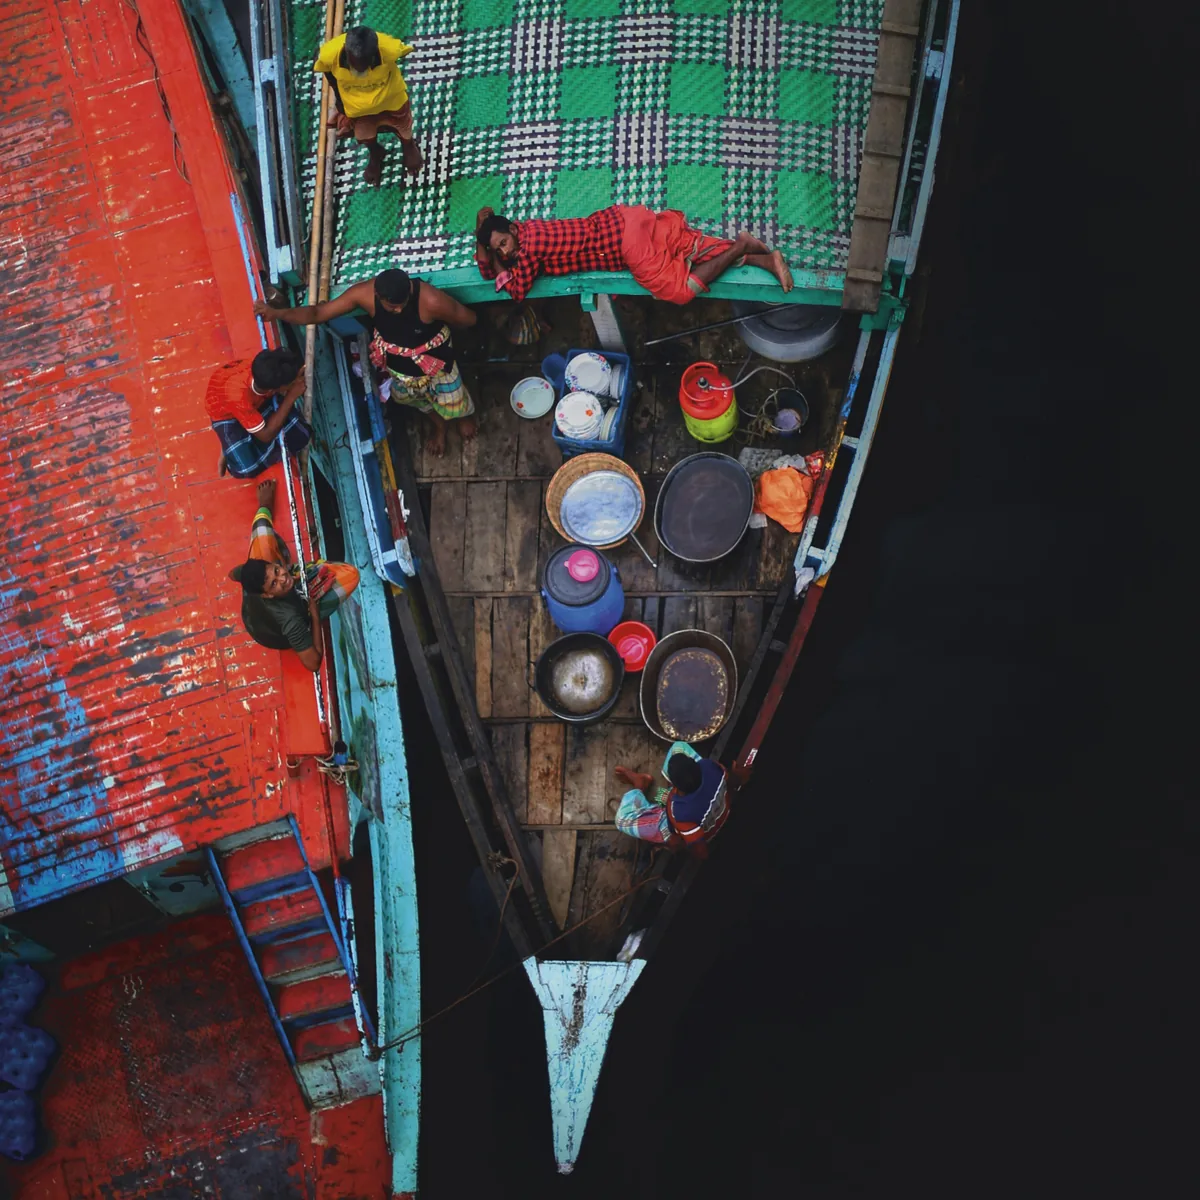
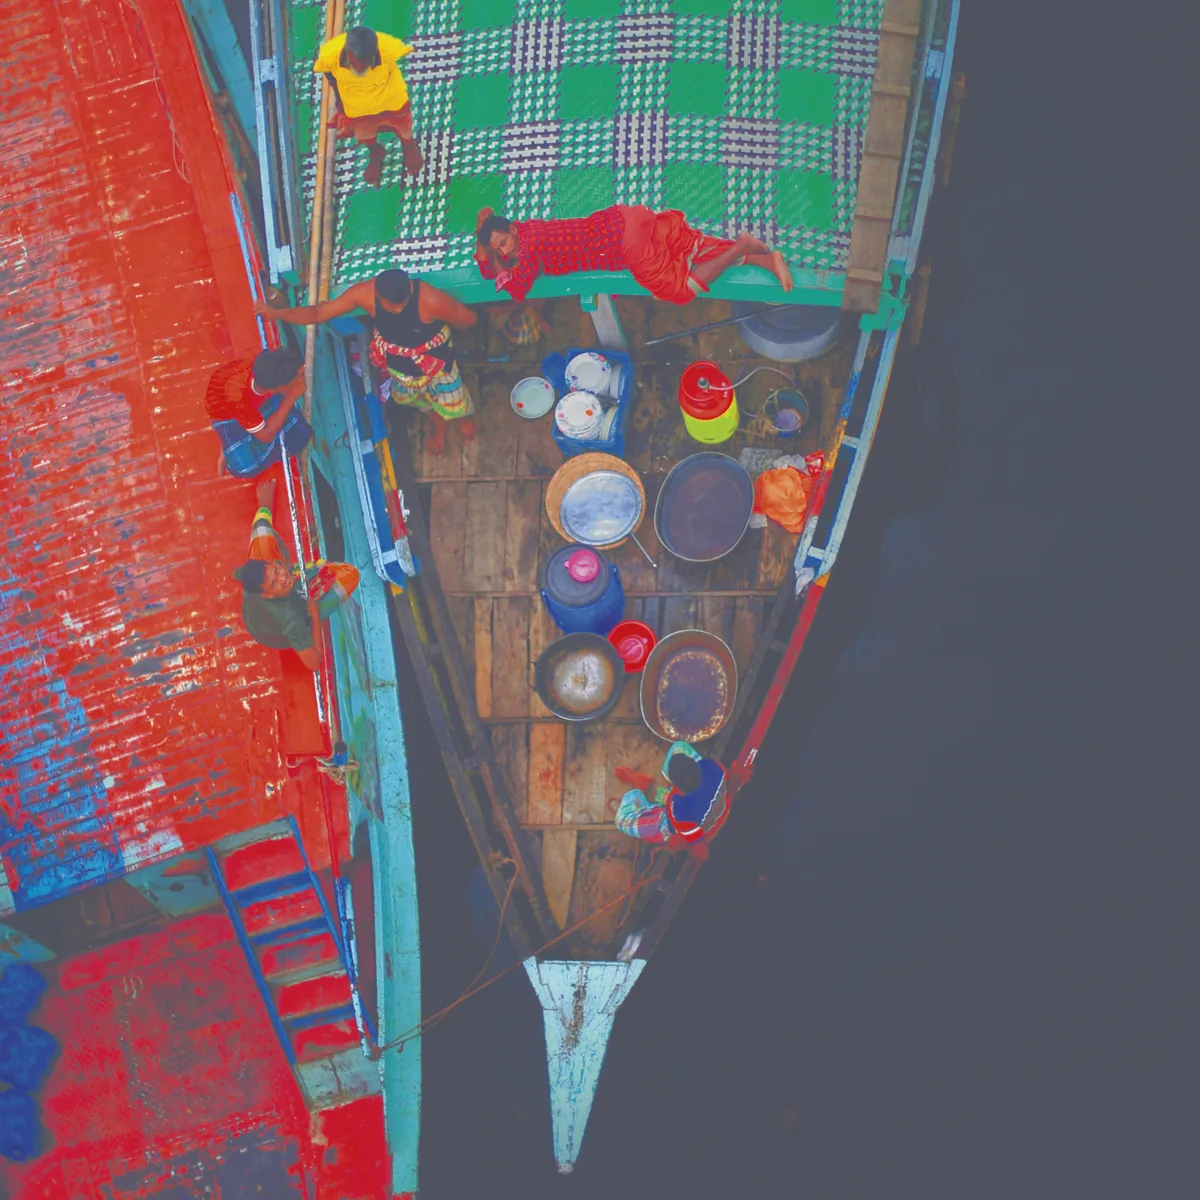
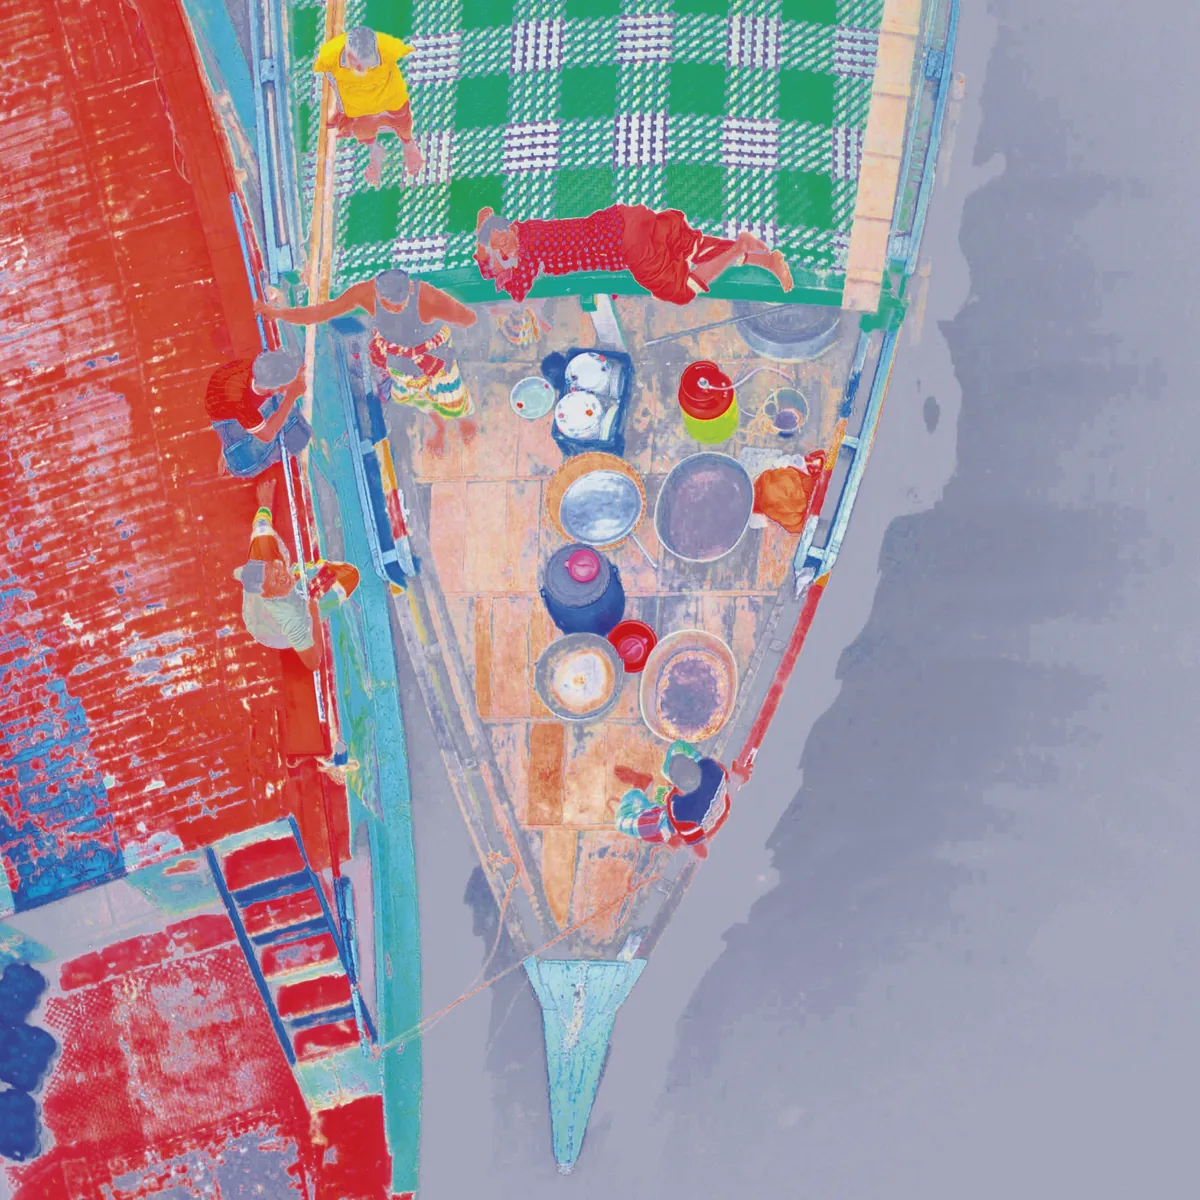
Before: standard ICC conversion to GRACoL 2013. After: GCRflow, GRACoL 2013, GCR80, rich-black boost on, TAC 320%. Total ink on this file: average 252.9% → 180.5%, maximum 318.8% → 267.5%. Results depend on the file. Photo: Tonmoy Iftekhar / Unsplash.
The images on this page are RGB renderings of the CMYK files, made for display; the figures below come from the CMYK files.
Conditions
| Version | Conditions |
|---|---|
| Source | Photo by Tonmoy Iftekhar on Unsplash, 2667 × 4000 pixels, sRGB JPG |
| Before | Standard ICC conversion to GRACoL 2013 (CRPC6) |
| GCR50 | GCRflow · GRACoL 2013 (CRPC6) · GCR50 · TAC limit 320% |
| GCR80 + rich-black boost | GCRflow · GRACoL 2013 (CRPC6) · GCR80 · rich-black boost on · TAC limit 320% |
The images show Before and GCR80 + rich-black boost. GCR50 appears in the tables only. The rendering intent of the standard conversion was not recorded.
Ink on every pixel
| Version | Total ink, average | Total ink, maximum | C, average | M, average | Y, average | K, average | C + M + Y, average | Area above 300% total ink |
|---|---|---|---|---|---|---|---|---|
| Before | 252.9% | 318.8% | 66.5% | 62.0% | 56.8% | 67.6% | 185.3% | 40.1% |
| GCR50 | 207.4% | 269.4% | 47.8% | 46.3% | 40.5% | 72.8% | 134.6% | 0.0% |
| GCR80 + rich-black boost | 180.5% | 267.5% | 40.6% | 36.6% | 29.9% | 73.5% | 107.1% | 0.0% |
How it was measured: every pixel of the full image (2667 × 4000, 8-bit CMYK); each channel value / 255 × 100. Total ink is C + M + Y + K at a pixel; the last column is the share of pixels whose total ink is above 300%.
Only ink was measured. Color difference between the versions was not measured.
How to read the images
- Composite: compare how before and after look as a whole. These are on-screen renderings; judge final color on a proof.
- CMY view (C, M and Y together, black left out): dark areas in this view are built from C, M and Y; after GCR they are much lighter, because black carries the gray component instead.
- In the ink table, the C + M + Y average falls by 78.2 percentage points while the K average rises by 5.9 (GCR80 + rich-black boost against before).
Limits of this example
- This photo has large dark areas, which makes the drop in total ink larger.
- Results depend on the file. These figures describe this file under these conditions only.
About the photo
Photo: Tonmoy Iftekhar / Unsplash (Unsplash License).
- The original photo on Unsplash
- Total ink limits by paper standard — The limits offered for GRACoL 2013 and Fogra 27, 39 and 51.
- Try it on your own file — Open the converter.